
Ten live drill-downs: every number traced to your real portfolio.
Cash flow, arrears, compliance, tenants, bonds and more, read from your actual data, not a spreadsheet you maintain.

The Reports surface turns your live portfolio into ten interactive drill-downs: finance, arrears, maintenance, inspections, compliance, tenants, bonds, documents, market and automation. Every figure is grounded in your real records with the source one tap away, so you can trust the number and act on it.
Your whole month, read for you
Reports opens on the numbers that matter: money in and out, portfolio health, occupancy, and what needs your attention. From there you drill into any of ten dedicated views. Custom charts render your real cash flow, arrears ageing and maintenance spend without a single formula for you to maintain.
Grounded, never guessed
Every figure is computed from your live records and windowed correctly: leases, payments, jobs, inspections and bonds, with financial-year income from first-released dates, bonds from the lease, waivers excluded. Tap a number and LORDLY opens the exact record behind it, so the report is a starting point for action, not just a picture.
From insight to decision
The market drill-down surfaces comparable rents and where you sit against them; the automation view shows what the AGENT handled for you this month. Together they answer the questions a good PM would raise at a portfolio review, and the answers are already done.
Exactly where it lives.
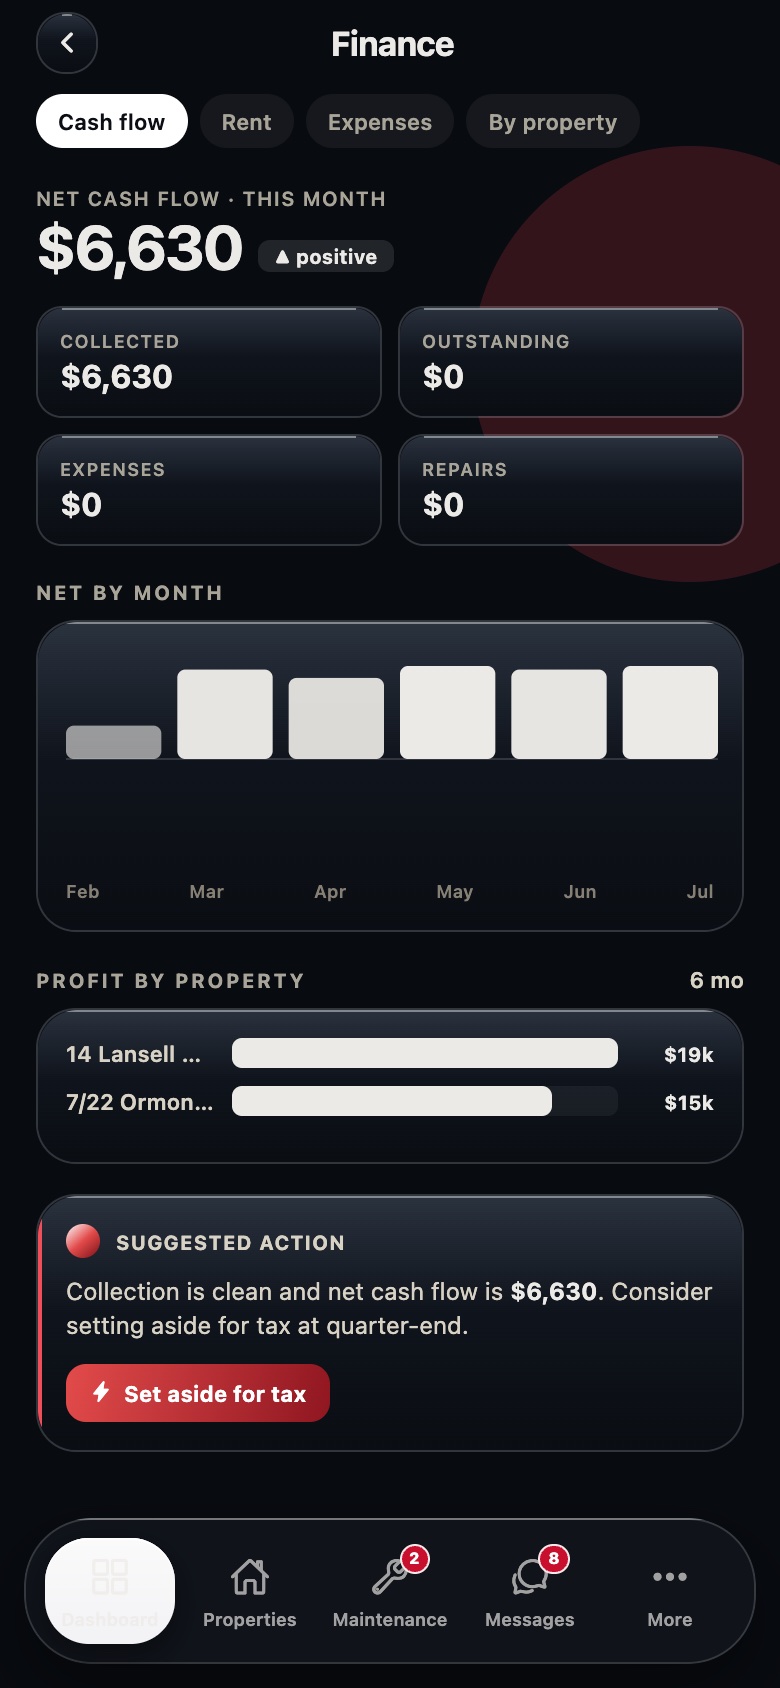
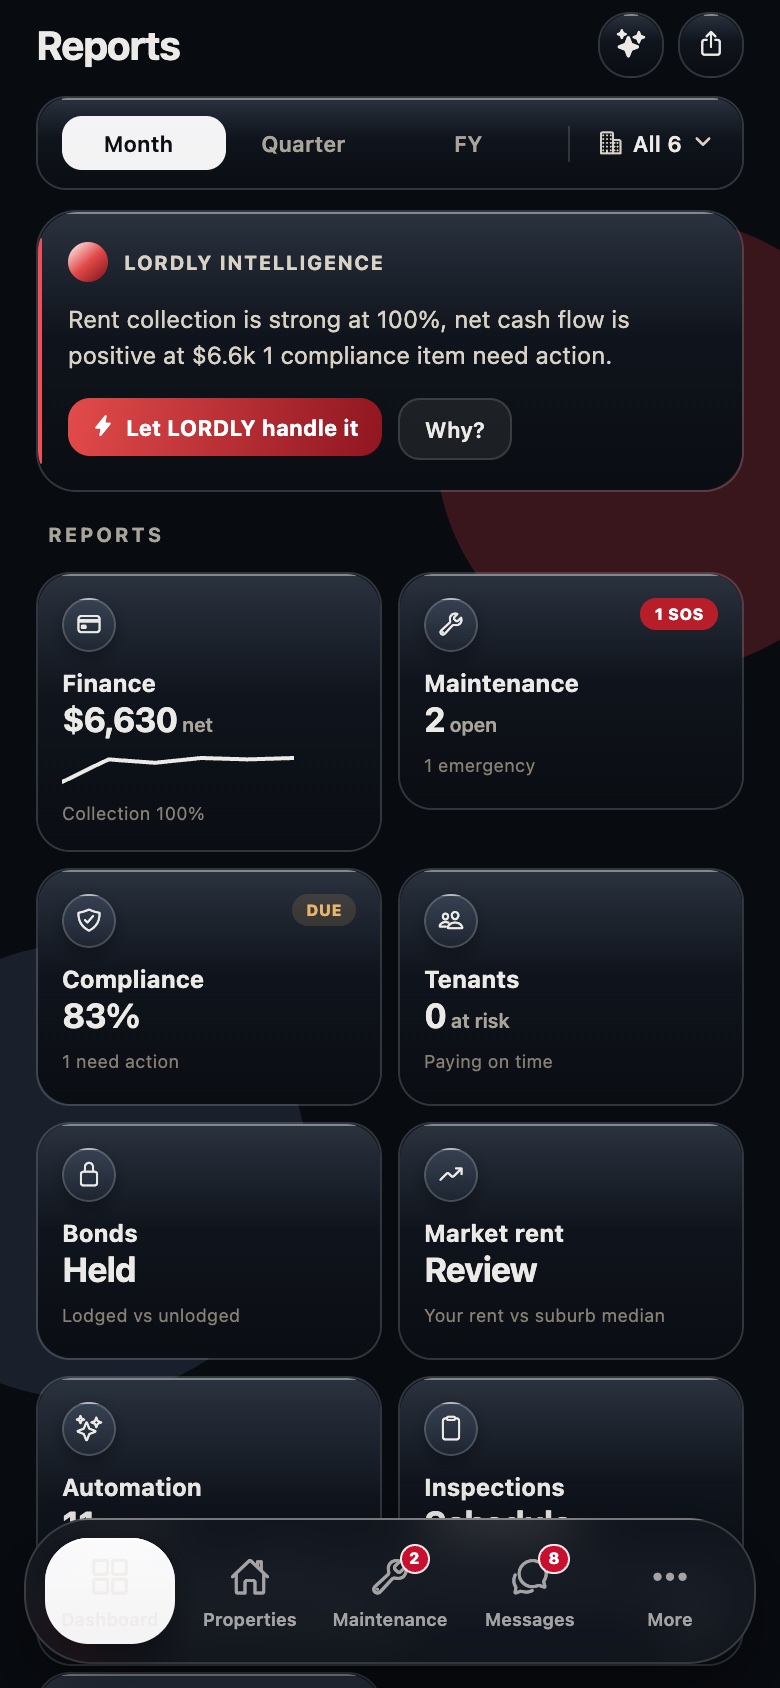
Real LORDLY app screens · demo portfolio shown · yours once signed in.
From start to done.
- 1Open ReportsThe dashboard leads with cash-in / cash-out, portfolio health and occupancy across every property.
- 2Pick a drill-downChoose finance, arrears, maintenance, inspections, compliance, tenants, bonds, documents, market or automation.
- 3Read the chartCustom-rendered charts show trend, ageing and composition, computed from your live records.
- 4Trace any figureTap a number to open the underlying record: the lease, payment, job or inspection behind it.
- 5Export or actDownload the underlying data, or jump straight into the action the report surfaced.
In the app and on the desktop.
- The full Reports tab in your pocket
- Portfolio health score and occupancy at a glance
- Tap-through from any figure to its source record
- Grounded AI answers about your own numbers
- Ten drill-downs on a big screen with a sticky KPI rail
- Consistency heatmap across the whole portfolio
- Side-by-side property comparison
- One click to export any view for your accountant